
CVC CORP
Product Analytics
Building a UX Data-driven process for mobile apps using a solid structure of metrics
About the project

I worked on this project as the only product analytic and designer inside the team

The first time that the company had key digital indicators to measure the app.

To implement research components in the design system for continuos metrics.
.svg)
Working with data is a cultural mindset, and selling this isn't the easiest. In this step, I had to engage in conversations with managers and directors to promote the idea.

When we talk about metrics, we need to understand which KPIs really matter for a specific company and its current business context.
.svg)
When discussing the collection of data from users, such as NPS, CSAT, and CES, we need to devise a method of inquiry that doesn't adversely affect the user experience.
CVC Corp is one of the largest companies in Brazil and the biggest one within the tourism market in South America. Due to the COVID-19, the digital team has been growing fast, leading to an increased need to monitor and understand the usage of digital products.
The main challenge was to establish a data-driven process, utilizing metrics such as Stickiness, CSAT, and Retention, to provide insights for the product team. Simultaneously, it aimed to enable managers to pursue results based on app usage.
Identifying crucial company metrics and assessing existing events, tags, and tools.
Defining the core metric for each app based on the company's vision for its digital products.
Structuring how each KPI in the metric tree is measured, involving time, benchmark comparisons, and goals.
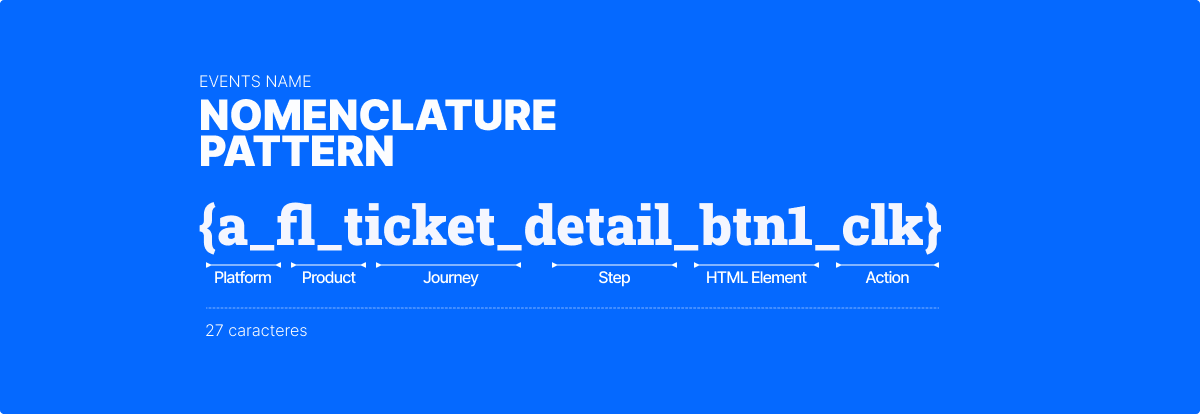
Aligning with the tech team to structure events using MixPanel. Defining names, documentation, and properties.
Creating components in the design system to capture user scores (CES and CSAT) on the app screen.
Tracking metric results post-releases with MixPanel to understand the user's behaviors and get insights.
After acquiring core metrics aligned with the business requirements for each digital product, the next step is to grasp how an app influences these key indicators. To do so, we defined a process and a metric tree, creating four principles and a two-level tree with product indicators linked to the core metric. This allows us to categorize users based on their engagement with our app.


For this work, we must define how to measure each metric in the tree, including the time frame, specific goals, and a solid benchmark. This process was applied to all 10 metrics.
The time that we need to wait in order to notice any impact
The number that we are going to pursue in order to get success
What defines you are well positioned for each metric
Understand how a specific metrics works inside its market
The first step involved establishing a strong event structure and a consistent naming convention to collect necessary data from the app. Using Mixpanel, a potent tool for product teams, we analyzed created events to understand adoption and usage patterns, categorizing users into cohorts based on their behavior within the mobile application.
With cohorts, we understood the real scenario inside the app. Before that, the management team kept the wrong vision of adoption and even active users. The old Active User concept was metrified by the total number of apps installed. Now the new Active User Cohort is metrified by a unique {AppSession} event performed within 7 days. After that, the real scenario was noticed and the Active User number dropped more than 90% percent, showing the lack of engagement on the main B2B mobile app inside the company.


As lead designer for a data-driven project, I shaped the strategic vision by creating custom capture components for NPS, CSAT, and CES metrics in-house. This ensured seamless integration, cost-effectiveness, and operational efficiency, reflecting our commitment to excellence in data-driven initiatives.

A new way to metricize and understand user behavior within your mobile application, enabling the application of a Design Data-Driven process.

Research smart components that enable us to save money using tools and gather all metrics according to our own criteria and needs, based on our specific context.
Using all the potential of Mixpanel to create a real-time dashboard that displays the current user's behavior, allowing everyone in the company to access it.


It's common for stakeholders to have inaccurate concepts of users, such as active and churn. Aligning the entire company in the same direction is essential.

To align with stakeholders, establish a North Star based on the business necessity. It will be the primary goal for the product and design teams across the years.

The event structure and research components (when necessary) should be simple and effective. Additionally, maintain an easy and consistent handoff process.